Telus
TELUS 2005-2023
To review a company you look at certain financial metrics and see how they grow and flow. The companies that are great have the figures travelling together in a certain way. You develop this insight as you progress your ability.
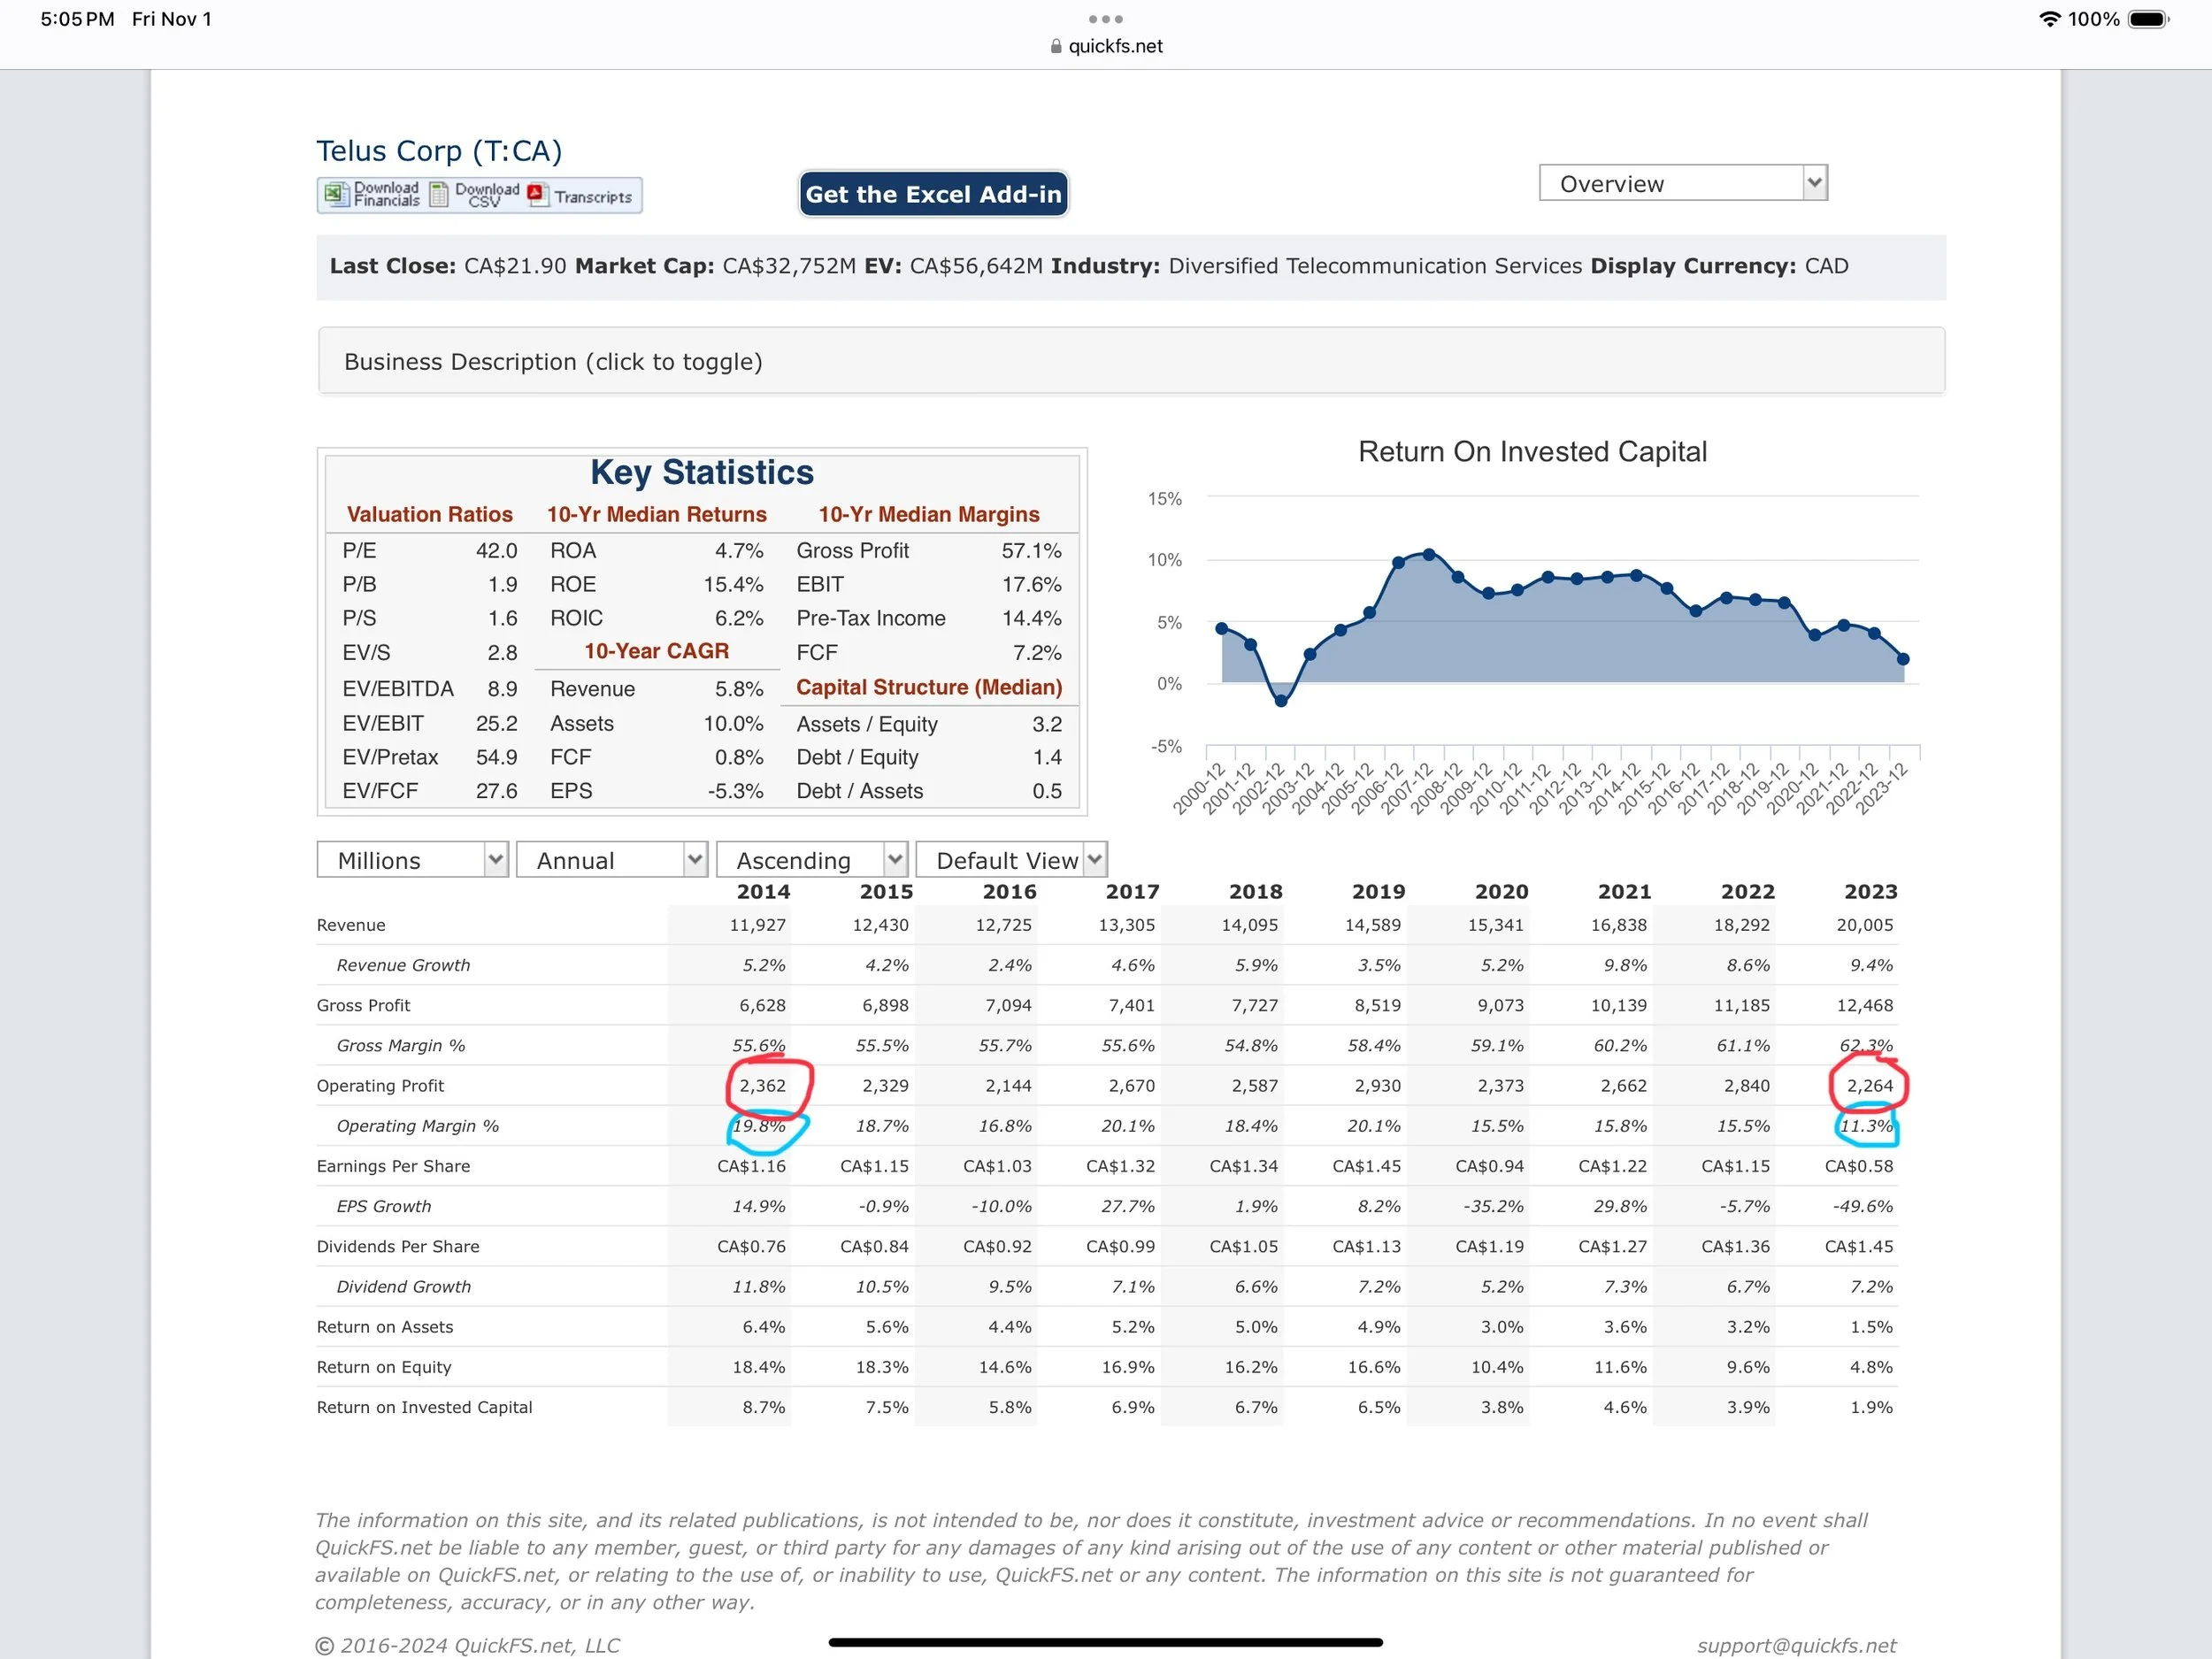
Here is a snapshot of Telus for the last 2 decades..
DEBT 11.34% per year. CAGR (Compound Annual Growth Rate)
Where:
Ending Value = $27,453,000,000.00
Beginning Value = $4,644,900,000.00
Revenue CAGR 5.31% per year
Where:
Ending Value = 20,005,000,000.00
Beginning Value = 8,142,700,000.00
Operating income CAGR 2.05% per year.
Ending Value = 2,362,000,000.00
Beginning Value = 1,671,600,000.00
Shares outstanding CAGR 0.05% per year.
Where:
Ending Value = 1,457,000,000.00
Beginning Value = 1,444,000,000.00
Cash from operations CAGR 2.86% per year.
Where:
Ending Value = 4,499,000,000.00
Beginning Value = 2,914,600,000.00
Goodwill CAGR 9.07% per year
Where:
Ending Value = 29,779,000,000.00
Beginning Value = 6,759,000,000.00
Total assets CAGR 7.92% per year.
Where:
Ending Value = 56,136,000,000.00
Beginning Value = 16,222,300,000.00
Dividend payout CAGR 8.04%
Where:
Ending Value = 1,315,000,000.00
Beginning Value = 312,200,000.00
Total Dividends paid = 15,364,328,600.00
Total Debt increase 22,808,100,000.00